Introduction
It is not essential to make a proposal to venture capital firms with regards to the price of the round – most investors run their own valuation and returns models in considering their offers; however, it is important to understand how valuation works so that you can have a meaningful discussion with potential investors, and ultimately judge and respond to offers.
If you are raising from a group of investors, then you would typically negotiate and agree the valuation with the lead investor in the first instance, which may then be tweaked depending on how discussions go with the other investors. If you have no lead investor, you may find it is simply more practical to provide a proposal on valuation than to rely on individual proposals from investors. Certain corporate-backed and strategic investment funds also rely more heavily on businesses conducting their own valuation analyses, compared to traditional venture capital funds.
It is very difficult to price small, high growth companies, as it involves a significant amount of judgement and guesswork. The core valuation principles that apply to large, listed companies, stock markets and even private equity backed companies, are difficult to apply as they rely heavily on multiples of profit and do not take into account the rapid growth rate of many small companies.
Ultimately, the theorems underpinning corporate valuation are a representation of the collective view held by investors of an appropriate risk-adjusted return. Therefore, once you have a starting point for discussion with investors, you will soon find out whether they agree that it represents an attractive risk-adjusted return through uptake and / or negotiation. The objective being to settle on a price that all parties are comfortable with and represents a fair return for both existing shareholders and new investors.
A brief recap of what “valuation” means
The value of a business is called the “Enterprise Value” or “EV”. It is a common misconception that valuation increases when you raise equity – this is incorrect. It is not possible to alter the value of a company through changing the way in which it is financed – only through utilising that investment to generate more money, can value be created.
As a side note - it’s worth being aware that this misconception, surprisingly, has also made its way into the venture capital funds themselves. If investors refer to the value increasing upon investment, they are referring to the equity value alone, and not the value of the business.
The EV (the value) of a business remains the same before and after raising money. The terms pre-money equity value and post-money equity value refer to a portion of the EV only.
The EV represents the total value of claims that each stakeholder has on the business. Stakeholders comprise:
- Debtholders, who have lent money to the business
- Equityholders, who we typically call shareholders as they own shares in the business
Debtholders rank in priority to shareholders.
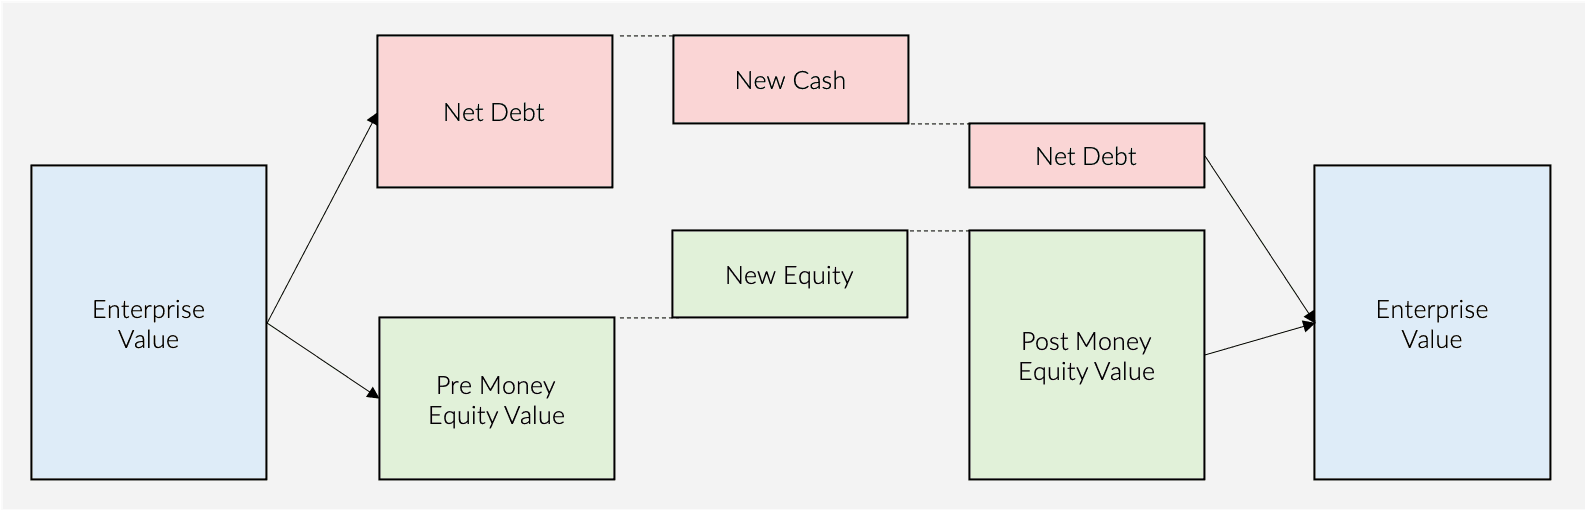
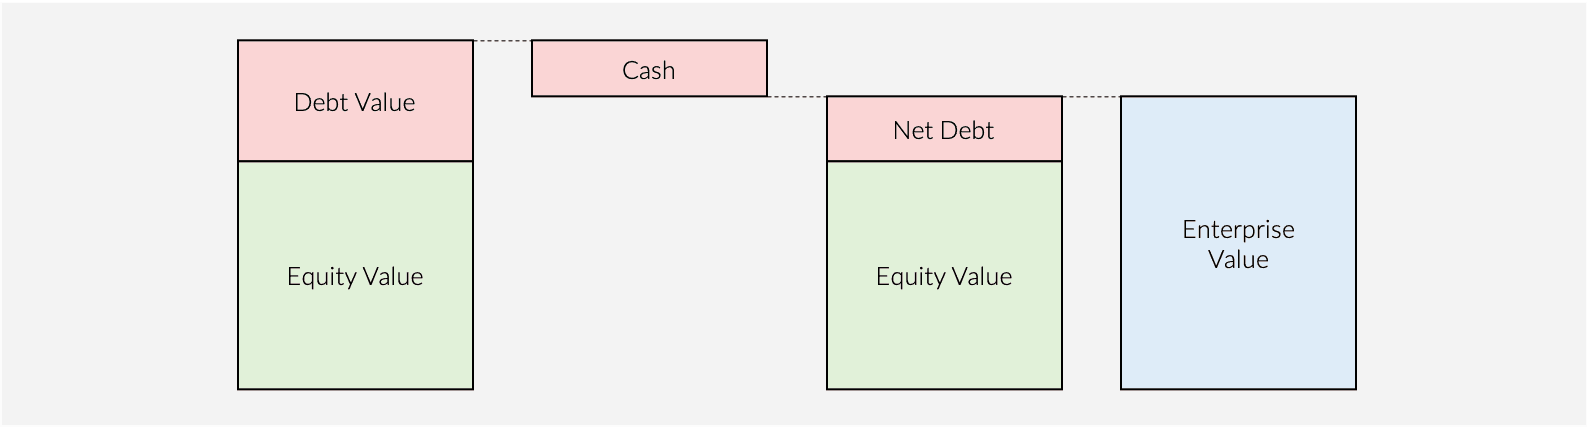
EV is essentially the value owned by the debtholders (“Debt Value”) plus the value owned by the shareholders (“Equity Value”), minus the cash sitting on the balance sheet. If there is cash on the balance sheet, then this can theoretically be used to pay back some of the debtholders. Debt minus cash is referred to as Net Debt and therefore:
EV (£) = Equity Value (£) + Net Debt (£)
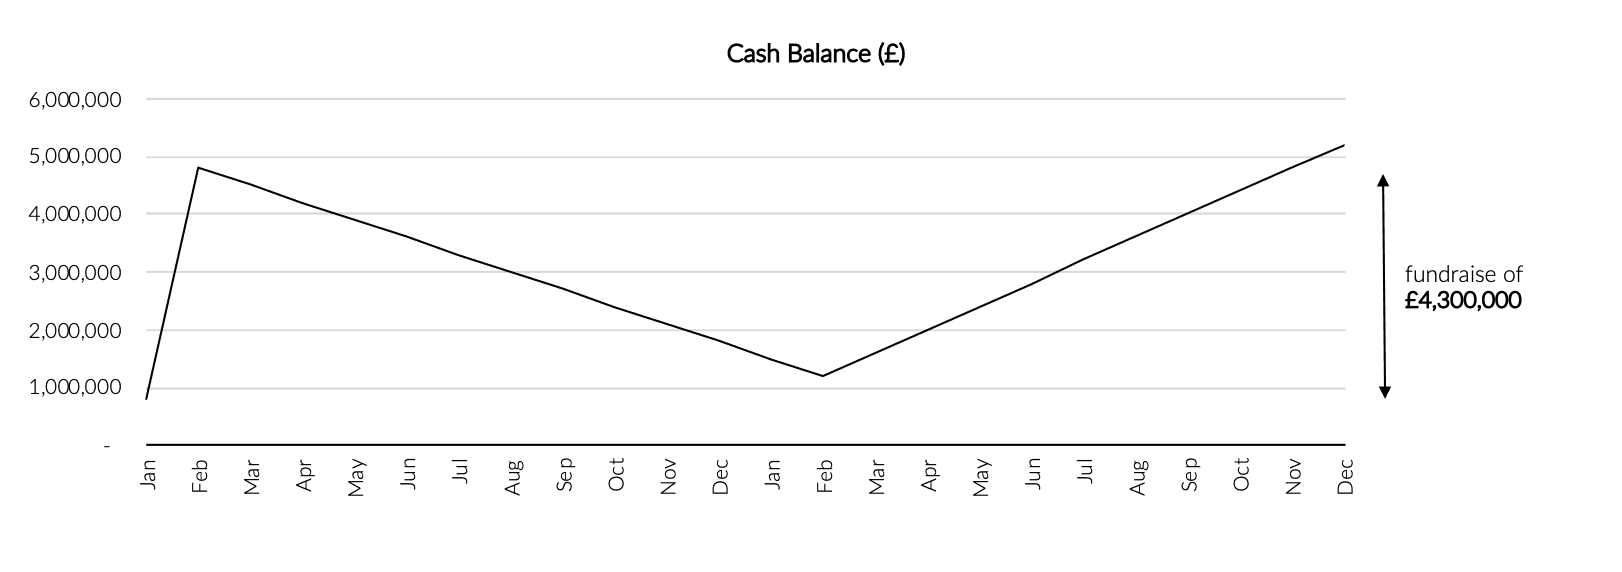
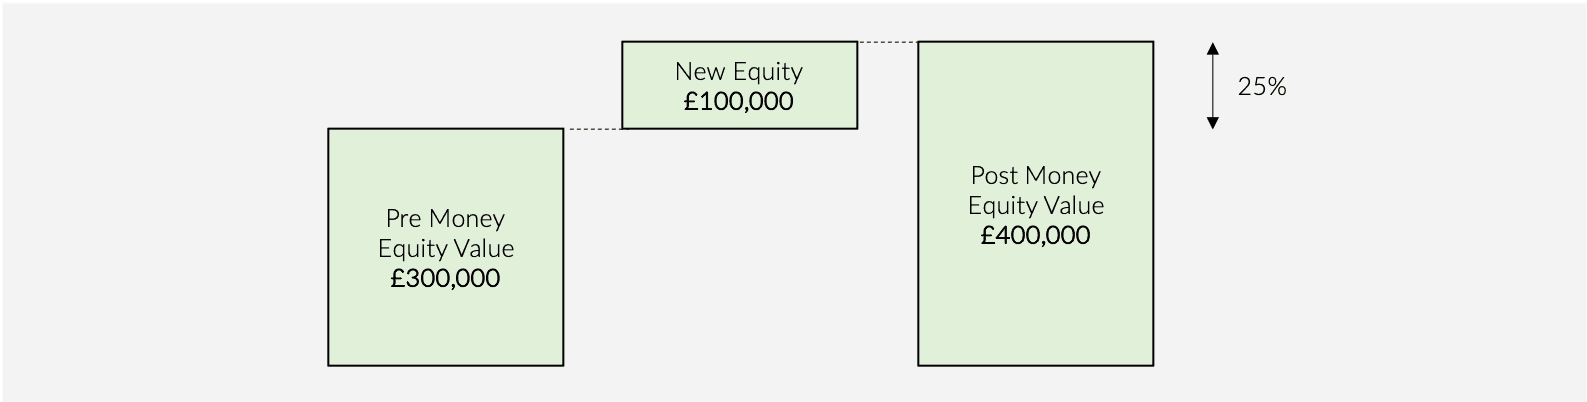
If the business has no debt and no cash (and debt includes shareholder loans), then the fundraise will look like this:
The newly issued shares represent new equity value, and thus the post-money equity value is higher than the pre-money equity value.
The new cash on the balance sheet is effectively negative net debt and is deducted to reach the post-investment EV – which will always equal the pre-investment EV.
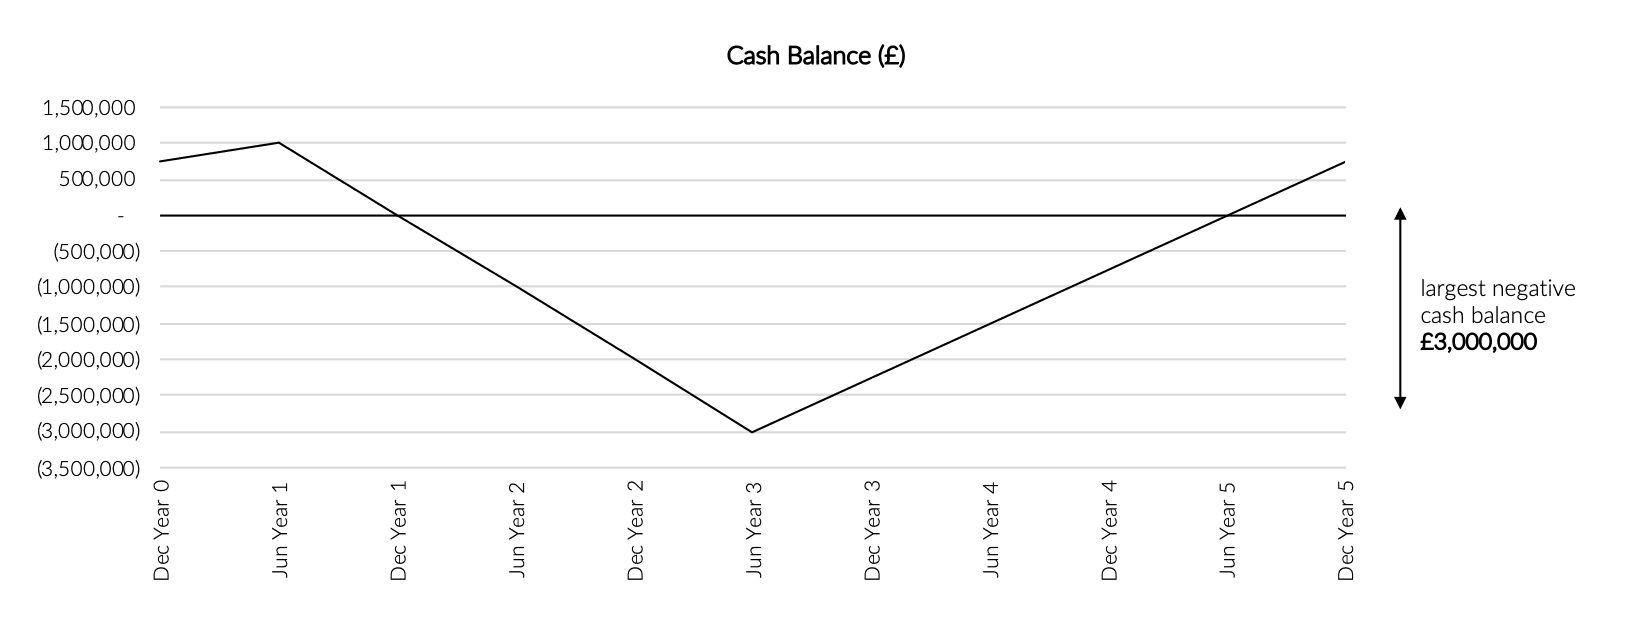
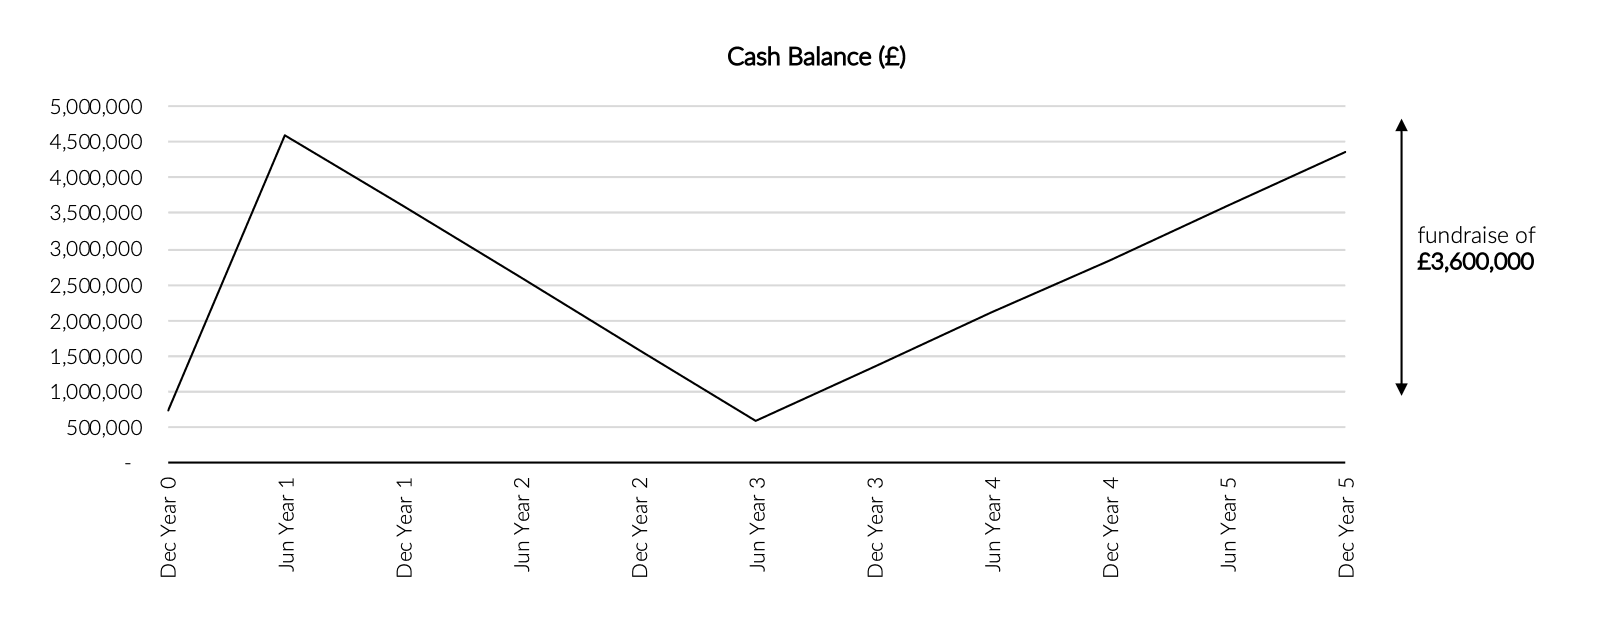
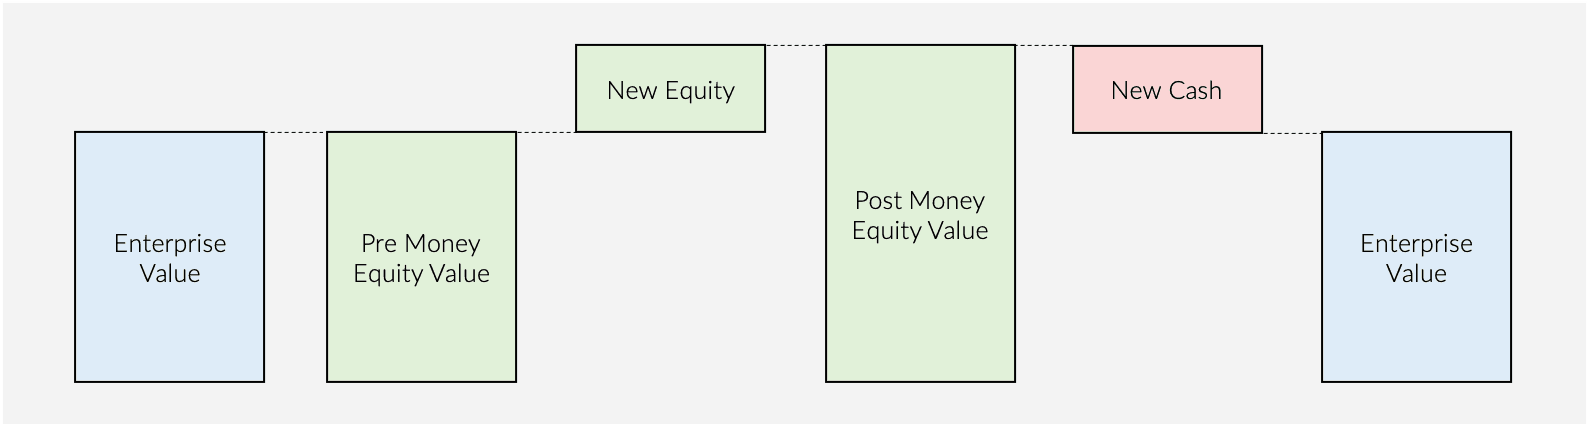
If you have debt or shareholder loans on your balance sheet, that exceed your cash balance, then your fundraise will look like this:
The newly issued shares increase the equity value but the new cash reduces net debt and thus EV remains the same.
How to present a valuation proposal to investors
It is important when pitching to investors to be clear which metric is being used when talking about price or valuation. For venture rounds, it is common to refer to the pre and post-money equity value while making investors aware of any existing debt and cash balances.
A typical proposal would read as follows:
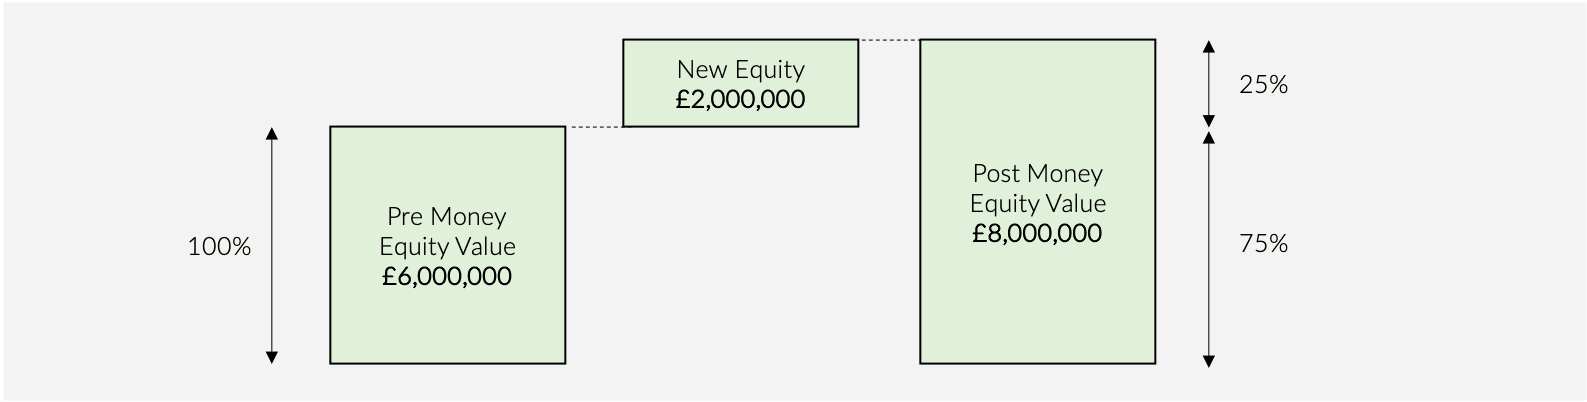
“We are seeking investment of £2,000,000 in return for 25% of the equity in the company”
In this example, the implied post-money equity value is:
Post Money Equity Value (£) = New Equity (£) / Equity Stake (%)
i.e. £2,000,000 / 25% = £8,000,000
The pre-money equity value is:
Pre-Money Equity Value (£) = Post Money Equity Value (£) – New Equity (£)
i.e. £8,000,000 - £2,000,000 = £6,000,000
How do venture capital firms look at valuation?
In the same way that investments work in other industries, such as in the commodities, corporate bonds and property markets, the fundamental principle of corporate valuation is that the price paid should be such that, when the investor exits their investment, they receive an appropriate return on their money for the risk that they have taken on.
In order to grow and raise further funds themselves, venture capital funds wish to demonstrate to their own investors that not only will they generate an appropriate return for the risk, but they will generate above-average returns (something investment bankers call “alpha”).
Valuation is therefore important – if too high a price is paid across too many investments, the fund will not generate a sufficient return.
Venture capital funds typically measure the risk adjusted return in two ways:
- Return on Investment (ROI): also known as money multiple or cash on cash, this is the amount of money received when exiting the investment divided by the initial investment, for example, £7,000,000 generated through a public listing on £1,000,000 originally invested represents a 7.0x return.
- Internal rate of return (IRR): this is effectively the annual rate of return on the investment. The formula is relatively complex (and best calculated using the XIRR formula in Excel), but it converts lumpy cash flows, which are synonymous with venture investments, into a simple, comparable annual rate of return.
The former is the most commonly used when assessing the valuation of potential investee companies, so to keep this simple, we will focus here.
To generate an appropriate risk adjusted return across the fund, venture capital firms must take into account the failure rate of small companies. When assessing new investment opportunities, it is not uncommon for funds to target potential returns of 10-20x their initial investment.
A 10x return on a £2m investment requires £20m to be returned to the fund on exit – if that occurs over a 5 year period, it represents an IRR of almost 60%. This is why venture capital is a more expensive form of financing when compared to bank loans or mezzanine financing, but it is also significantly riskier for the fund, as it is highly likely some or many of their investments will underperform or even fail.
It is the strategy of almost all venture capital funds, to generate this return through increasing the value of the business, not through attempting to under-pay for a company. A fair valuation on entry and exit distils the investment thesis down to the drivers of equity value over the investment horizon. So how do you estimate fair value on entry? One such method is known as the multiple method.
The multiple method
The multiple method relies on the assumption that companies operating within similar industries and with similar characteristics, are worth the same, or a similar, multiple of turnover and / or earnings.
Enterprise Value (EV, £) = Turnover (£) x Turnover Multiple (x)
Enterprise Value (EV, £) = EBITDA (£) x EBITDA Multiple (x)
The greater the likelihood of higher future earnings and therefore higher future returns, and the more certain those earnings are, the higher the multiple will be. For example, businesses and industries that are growing very quickly will typically command higher multiples of their current earnings. Businesses with good revenue visibility, for example those with long term customer contracts or recurring revenue, will also attract higher multiples because future earnings are more certain.
For example, a technology business with recurring revenues, good visibility of forecast income that is growing rapidly may be valued at 2.0x turnover and 12.0x EBITDA (Earnings before Interest, Tax, Depreciation and Amortisation). A similar business that is growing more quickly could be valued at 2.5x turnover and 15.0x EBITDA.
To gather applicable multiples to apply to your company’s turnover and EBITDA (if profitable), you can look at listed companies and comparable transactions. Here we will focus on comparable transactions as these are most relevant to venture rounds. The aim here is to find out what other investors and buyers have paid for businesses that are similar to your own.
The first step is market research – who has invested in your industry and who has been acquired? There are a few good sources of this information, including Crunchbase. You could also check the websites of private equity or venture capital funds to see if they have acquired or invested in anything in your industry, and search the web for press releases relating to the deals. Try to find relatively recent investments (in the last 5 years).
For each acquisition, wherever the data is available (as it often is not), note down:
- The date
- The acquirer and the acquired company
- The price paid: this will be the best proxy for the company's EV
- The company's Turnover and EBITDA at the time of the acquisition
For each fundraise, note down:
- The date
- The investor and the investee company
- The amount invested
- The percentage equity acquired
- The company’s Turnover and EBITDA at the time of the investment
For the company’s financials, you may need to do a search of Companies House to review the accounts filed at the time.
Next calculate approximate Turnover and EBITDA multiples for each transaction. For acquisitions, this will be:
Turnover Multiple (x) = Price Paid (£) / Turnover at the time (£)
EBITDA Multiple (x) = Price Paid (£) / EBITDA at the time (£)
For investments, first estimate the post money equity value:
Post Money Equity Value (£) = Amount invested (£) / Equity Issued (%)
Then calculate the pre money equity value. In a business with minimal or no debt and cash, this is a close proxy for the Enterprise Value:
Pre Money Equity Value (£) = Post Money Equity Value (£) – Amount Invested (£)
To be theoretically accurate, you should calculate the EV using the net debt of each company; however, this is arguably an onerously detailed approach as you are looking for a guide, not an exact metric. If using the pre money equity value as a proxy for EV then:
Turnover Multiple (x) = Pre Money Equity Value (£) / Turnover at the time (£)
EBITDA Multiple (x) = Pre money equity value (£) / EBITDA at the time (£)
You will now have a set of Turnover and EBITDA multiples (though most likely fewer of the latter if some are loss-making companies). Take the average or a weighted average, if certain companies are more similar to yours than others, and apply these multiples to your own Turnover and EBITDA:
Estimated EV (£) = Comparable Turnover Multiple (x) x Current Turnover (£)
Estimated EV (£) = Comparable EBITDA Multiple (x) x Current EBITDA (£)
If your business is loss making, then only the Turnover approach will apply. If your business is profitable, and generating what you consider to be a steady-state margin, then the EBITDA approach should take precedence over Turnover, as investors place greater importance on the generation of profit than turnover.
How to calculate the equity percentage for the new investment
With an estimate of your company’s EV, you can calculate the pre-money equity value:
Pre Money Equity Value (£) = EV (£) – Current Net Debt (£)
Post Money Equity Value (£) = Pre Money Equity Value (£) + Amount Raised (£)
Then the equity stake you would offer to investors is:
Equity Proportion of Newly Issued Shares (%) = Amount Raised (£) / Post Money Equity Value (£)
Sense check the investors risk-adjusted return
Using your forecast financial plan, you can estimate the potential exit value for your company and calculate the expected return to investors, ensuring this is likely to be sufficiently high for them to be interested.
Returns are typically measured on a 3-5 year investment horizon. In this example we will assumed 5 years:
Apply the average multiple used above to your Turnover and / or EBITDA in year 5 to calculate an estimate of the exit EV (i.e. the price that someone might pay for the business at that time). Note that you can use a different multiple on entry and exit as the metrics of the business may have changed. A lower growth rate would imply a lower multiple, but if the business is larger and more established, this could be justifiably left as is. Value that is not reflected in income or earnings could justify a higher multiple, for example, brand value or IP.
Calculate the proceeds to all shareholders:
Exit Equity Value (£) = Exit EV (£) – Exit Net Debt (£)
Then investor proceeds on exit are calculated as:
Investor Proceeds (£) = Exit Equity Value (£) x Investor Equity Stake (%)
Finally, calculate the investor’s expected return:
Investor Return (x) = Investor Proceeds (£) / Initial Investment (£)
If the return looks too low relative to the riskiness of the business plan, then you can adjust the following:
- Increase the growth rate assumed in the business plan
- Increase the margin assumed in the business plan
- Reduce the entry multiple so that the investor holds a larger equity stake for the amount invested.
At the end of this exercise, you should have a broad estimate of the equity stake to offer to, or accept from, investors in return for their investment, and relevant market data to back this up.
Calculating the share price and the number of shares to issue
Note that the share price of the company will be the same before the transaction and after the transaction – it follows the same logic as the Enterprise Value – each share does not become worth more purely through raising investment.
Share Price (£) = Pre-Money Equity Value (£) / Pre-Transaction Number of Shares in Issuance (No.)
Number of Shares Issued to New Investor (No.) = New Equity Invested (£) / Share Price (£)
And as a final error-check, the share price should also be:
Share Price (£) = Post-Money Equity Value (£) / Post-Transaction Number of Shares in Issuance (No.)
How to calculate dilution to existing shareholders
If you are the sole shareholder, this is simple, as following the round you will hold whatever is left of the equity – if new shares representing 25% were issued, then your existing shares will now represent 75% of the equity.
If you have multiple shareholders, it is best to model this through a cap table, but you can also calculate this individually as follows:
Shareholder A’s Equity % Pre-Transaction (%) = No. of Shares owned by Shareholder A (No.) / Total Pre-Transaction No. of Shares (No.)
Shareholder A’s Equity % Post-Transaction (%) = No. of Shares owned by Shareholder A (No.) / Total Post-Transaction No. of Shares (No.)
Setting out the pre and post shareholder structure
This should be done through a cap table. If you don’t have a cap table set up, you can use our dedicated venture-stage cap table resource [LINK].